Ellingham and Pourbaix Diagrams: Metal Stability in Gases and Water
How the Gibbs energy of oxidation, plotted against temperature or against potential and pH, governs both the extraction of metals and their corrosion.
The Ellingham and Pourbaix diagrams map where a metal is thermodynamically stable, in high-temperature gases and in water. This article explains both, with interactive models.
- Authors
- METNMAT Research Team
- Published
- Reading time
- 15 min read
Abstract
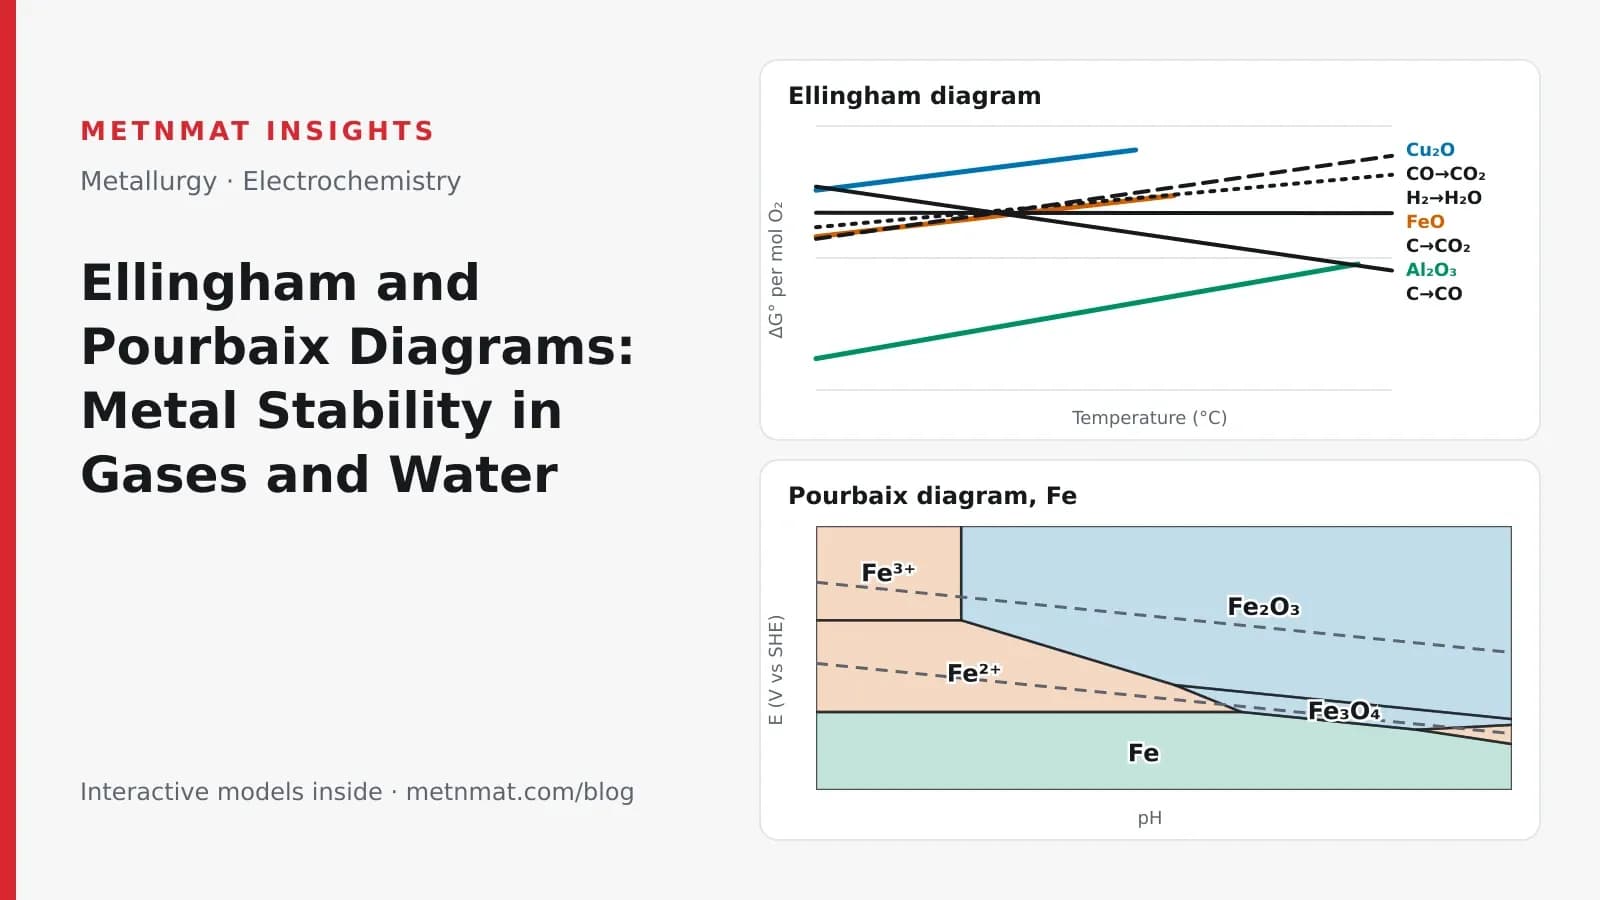
Ellingham and Pourbaix diagrams are two projections of the Gibbs energy of metal oxidation. The Ellingham diagram plots ΔG° per mole of O₂ against temperature; slopes set by the change in gas moles explain why carbon reduces wüstite above about 750 °C but alumina only near 2,050 °C, and its gas-ratio scales give the compositions a furnace must hold. The Pourbaix diagram plots electrode potential against pH at 25 °C through ΔG = −nFE, dividing the plane into immunity, corrosion and passivation fields. At 25 °C the two are linked exactly: an Ellingham value converts to the oxide/metal potential at pH 0 as E° = (ΔG° + 474 kJ)/4F.
- Keywords
- Ellingham diagram, Pourbaix diagram, potential-pH diagram, Gibbs energy, oxide reduction, blast furnace, hydrogen direct reduction, corrosion, passivation, immunity, cathodic protection, Nernst equation
- Research area
- Extractive metallurgy and corrosion
1. Introduction
Whether a metal is stable as the element or as one of its compounds is decided, at equilibrium, by the Gibbs energy of the reaction that converts one into the other. Two graphical representations of this quantity are used throughout metallurgy and electrochemistry. The Ellingham diagram plots the standard Gibbs energy of oxide formation against temperature and is the basis for choosing reductants and furnace atmospheres in high-temperature processing [1]. The Pourbaix, or potential–pH, diagram maps the stable form of a metal in water against electrode potential and pH, and is the standard first assessment of corrosion behaviour [4].
The two diagrams are normally taught in separate courses, extractive metallurgy and corrosion science, although they describe the same thermodynamic quantity under different conditions. This article has three aims: to explain how each diagram is constructed and read; to show, with interactive models, how the stability boundaries respond to temperature, gas composition, electrode potential, pH and dissolved-ion concentration; and to show that the two diagrams are quantitatively linked, so that data from one can be converted into the other. The discussion closes with consequences for ironmaking, aluminium production, hydrogen-based reduction, corrosion protection and electrolyser materials.
A familiar example frames the first half of the article. Aluminium is the most abundant metal in the Earth's crust, at about 8% by mass against roughly 5% for iron, yet iron has been produced by reduction with charcoal for more than three thousand years, while aluminium became an industrial metal only after electrolytic production was introduced in 1886. Section 3 shows that the Ellingham diagram accounts for this difference quantitatively.
2. Thermodynamic basis
For a reaction at constant temperature and pressure, the standard Gibbs energy change is
where is the absolute temperature and and are the standard enthalpy and entropy changes. In the Ellingham convention every oxidation reaction is written per mole of O₂, so that the vertical distance between any two lines at a given temperature is the standard Gibbs energy of the corresponding reduction reaction. Over intervals of a few hundred kelvin and change little, and each reaction is well described by a straight line:
The slope is therefore set by the entropy change, which for these reactions is dominated by the change in the number of moles of gas: the molar entropy of a gas is far larger than that of a solid or liquid. Three cases cover most of the diagram.
One mole of gas is consumed, J K⁻¹ per mole of O₂, and the line rises with temperature: the oxide becomes less stable on heating. Nearly all metal-oxide lines have similar positive slopes for the same reason.
Here one mole of gas yields two, J K⁻¹, and the line falls: carbon binds oxygen more strongly as CO the higher the temperature. The oxidation of carbon to CO₂ leaves the number of gas moles unchanged, and its line is almost horizontal.
In aqueous systems the same quantity is expressed as an electrode potential. For an electrochemical reaction transferring electrons,
where = 96,485 C mol⁻¹ is the Faraday constant. Each boundary on a Pourbaix diagram is an equilibrium of this kind, and its position follows from the Nernst equation (Section 4).
3. The Ellingham diagram
3.1 Interpretation
A lower line corresponds to a more stable oxide. Under standard conditions an element can reduce any oxide whose line lies above its own at the temperature considered. At room temperature the carbon monoxide line lies well above the FeO line, so carbon cannot reduce iron oxide. Because the two lines have slopes of opposite sign, they converge on heating; with the standard data used in the model below they cross at about 1,023 K (750 °C) [2, 3]. Above this temperature the reaction
has a negative standard Gibbs energy change. A charcoal fire with forced air exceeds 750 °C, which is why iron could be smelted with early technology. Copper oxide lies higher still: carbon can reduce it thermodynamically at almost any temperature, and heating serves mainly to accelerate the reaction. This is one reason copper was smelted thousands of years before iron.
Alumina represents the opposite case. Its line lies far below that of FeO, at about −1,060 kJ per mole of O₂ at room temperature compared with about −500 kJ. The descending carbon line reaches it only at about 2,330 K (roughly 2,050 °C). At that temperature aluminium is a liquid with a substantial vapour pressure, alumina is close to its melting point of 2,072 °C, and aluminium carbide forms. Carbothermic reduction of alumina is therefore impractical, and aluminium is produced electrolytically (Section 6).
3.2 Interactive model and suggested exercises
The model plots straight-line fits to standard data for the reactions discussed above. The following exercises illustrate its main features; it is instructive to predict each result before moving the controls.
- Set the temperature to 600 °C and compare the C → CO line with the FeO line. Then increase the temperature and identify the point at which carbon becomes able to reduce FeO.
- Locate the Al₂O₃ line and determine whether the carbon line reaches it within the temperature range shown.
- At 900 °C, compare the hydrogen line (2H₂ + O₂ → 2H₂O) with the FeO line. Then enable the H₂/H₂O scale and increase the hydrogen-to-steam ratio until the model indicates that hydrogen can reduce FeO.
Interactive model 1
Ellingham diagram: carbon, hydrogen, iron, copper and aluminium
The carbon line passes below FeO at about 750 °C, after which the model lists FeO among the oxides carbon can reduce. It meets the Al₂O₃ line only near the upper limit of the chart, above 2,000 °C. The hydrogen line remains above FeO throughout the range of practical furnace temperatures, so hydrogen and steam at equal partial pressures cannot reduce wüstite. Reduction becomes possible only when hydrogen is in excess: at 900 °C the model requires a ratio of about 2.5 parts H₂ to one part H₂O.
3.3 Equilibrium gas compositions
Each line represents an equilibrium at unit activity: pure metal, pure oxide and gases at one bar. Real processes depart from these conditions, and the auxiliary scales printed around a full Ellingham diagram convert the lines into the gas compositions required in practice. The oxygen-pressure scale gives the partial pressure of O₂ at which metal and oxide coexist:
Below this pressure the metal is stable; above it, the oxide. For FeO at 1,000 °C the equilibrium pressure is about bar, which explains why iron requires an actively reducing atmosphere rather than the mere exclusion of air.
The CO/CO₂ and H₂/H₂O scales give the corresponding ratios of reducing gas to its oxidation product. At 900 °C the linear data in the model indicate that wüstite is reduced to iron only in gas containing more than about three parts CO per part CO₂, or about 2.5 parts H₂ per part H₂O. Measured equilibria place both requirements somewhat lower (for CO, about two parts to one, or roughly two-thirds of the gas), the difference reflecting the linear approximation. The qualitative conclusion is unaffected: a gas consisting mainly of CO₂ or steam cannot reduce iron oxide.
Industrial relevance. Blast-furnace operation relies on this equilibrium. Carbon monoxide generated from coke ascends through the descending burden, and the Boudouard reaction () regenerates CO wherever the burden is hot enough. The CO₂ fraction of the top gas therefore measures how much of the reducing capacity has been used, and is monitored continuously. The same scales determine furnace atmospheres in heat treatment: excess CO₂ or water vapour decarburises or oxidises steel, and bright annealing of stainless steel requires hydrogen dry enough to reduce chromium oxide, which lies far down the diagram.
3.4 Hydrogen as a reductant
Three moles of gas yield two, so this line also rises with temperature, but less steeply than the metal-oxide lines ( J K⁻¹, compared with −138 J K⁻¹ for FeO). In the model it does not cross the FeO line until about 1,530 °C, well above the operating range of direct-reduction plants. Hydrogen reduction of iron oxide is consequently carried out with a large excess of hydrogen, typically at 800–1,000 °C in shaft furnaces from which the water formed is continuously removed.
Relative to carbon monoxide, hydrogen is the weaker reductant below about 820 °C and the stronger one above it (about 850 °C with the model's linear data). This crossover corresponds to the equilibrium of the water–gas shift reaction, CO + H₂O ⇌ CO₂ + H₂, and appears on the diagram as the intersection of the H₂O line with the 2CO + O₂ → 2CO₂ line. Two further differences matter in practice. Reduction of iron oxide by CO is mildly exothermic, whereas reduction by hydrogen is endothermic, so hydrogen-based processes must preheat the reducing gas. Conversely, the small hydrogen molecule diffuses rapidly through the pores of partly reduced pellets, and hydrogen frequently reduces iron oxide faster than CO at the same temperature.
These considerations are central to low-carbon steelmaking. Iron and steel production accounts for roughly 7–9% of global CO₂ emissions, and hydrogen performs the same chemical function as carbon while producing water. The HYBRIT project, a joint venture of SSAB, LKAB and Vattenfall, has produced sponge iron in a pilot plant at Luleå, Sweden, using hydrogen from water electrolysis. The hydrogen demand follows directly from stoichiometry: for , one tonne of iron requires at least 54 kg of hydrogen. At 50–55 kWh per kilogram of electrolytic hydrogen, this corresponds to close to 3 MWh of electricity per tonne of iron, before any heating.
4. The Pourbaix diagram
4.1 Construction
In aqueous environments oxygen is supplied not as a gas but through water and hydrogen ions, and the variable that controls oxidation is the electrode potential. A Pourbaix diagram plots the potential, referred to the standard hydrogen electrode (SHE), against pH. Each line is an equilibrium between two forms of the metal, positioned by the Nernst equation. For the dissolution of iron as Fe²⁺:
The orientation of a line indicates which species take part in the equilibrium. Horizontal lines involve electrons but no hydrogen ions (Fe²⁺/Fe, Fe³⁺/Fe²⁺). Vertical lines involve hydrogen ions but no electrons, so that pH alone determines the boundary (precipitation of Fe³⁺ as Fe₂O₃). Sloping lines involve both and fall by 59 mV per pH unit for each hydrogen ion per electron transferred; for example, the equilibrium gives [4].
Two further lines, conventionally dashed, describe the stability of water itself. Below the lower line water is reduced to hydrogen; above the upper line it is oxidised to oxygen. The lines are 1.23 V apart at every pH, and most natural waters and soils lie between them.
4.2 Immunity, corrosion and passivation
Pourbaix divided the diagram into three types of region. Where the metal itself is the stable phase, it is immune and cannot corrode. Where a dissolved ion is stable, the metal corrodes. Where a solid oxide or hydroxide is stable, the metal may be passivated, provided the resulting film is dense and adherent enough to separate the metal from the solution.
The boundary between corrosion and the other regions depends on the concentration chosen to define dissolution. The conventional value is an activity of mol/L: a metal that cannot dissolve to this level is regarded as effectively stable. Every line involving a dissolved species shifts when this value is changed, which the model allows the reader to examine directly.
4.3 Interactive model and suggested exercises
The model reproduces the iron–water diagram, with haematite and magnetite as the solid phases, from the thermodynamic data in Pourbaix's atlas [4].
- At pH 7 and 0 V, identify the stable species. Then lower the potential until the model reports immunity, and compare this potential with the hydrogen line.
- At pH 1, increase the potential from −1.5 V and determine whether a solid oxide becomes stable at any potential.
- The pore solution of sound concrete has a pH of about 13. Set pH 13 and −0.5 V, then reduce the pH to 8, a value typical of carbonated concrete, at constant potential.
- Reduce the corrosion threshold from 10⁻⁶ to 10⁻⁸ mol/L and observe which regions expand.
Interactive model 2
Pourbaix diagram for iron in water at 25 °C
At an activity of , iron becomes immune only below about −0.62 V in neutral and acidic solution. This lies well below the hydrogen line, so iron in contact with water is always thermodynamically able to corrode. At pH 1 no solid phase is stable at any potential: iron passes from immunity directly to Fe²⁺ and then Fe³⁺, and strong acid simply dissolves it. At pH 13 and −0.5 V the stable phase is the oxide Fe₂O₃, consistent with the passivity of steel reinforcement in sound concrete. At pH 8 the same potential lies in the Fe²⁺ region, which is why carbonation of concrete leads to corrosion of the reinforcement. Lowering the corrosion threshold enlarges every region bounded by a dissolved species, since dissolution to a lower concentration is thermodynamically easier.
4.4 Application to corrosion protection
Because corrosion is determined by the position of the metal on the diagram, it can be controlled by shifting the potential. Cathodic protection lowers the potential of a pipeline, ship hull or offshore structure towards the immunity region, either with sacrificial anodes of zinc, aluminium or magnesium or with an impressed current. The criterion long used for buried pipelines, −0.85 V against a saturated copper/copper-sulphate electrode (about −0.53 V vs SHE), lies close to, but not on, the iron immunity line. It is an empirical criterion, effective in part because the cathodic reaction makes the steel surface alkaline and moves it towards the oxide regions of the diagram. The converse technique, anodic protection, raises the potential of carbon or stainless steel into a passive region and holds it there; it is used, for example, for storage tanks of concentrated sulfuric acid.
Laboratory note. The predictions of the diagram can be tested directly. Measure the open-circuit potential of a mild-steel coupon against an Ag/AgCl reference electrode in buffers at pH 2, 7 and 12, with one set deaerated by nitrogen, and convert each value to the SHE scale by adding about 0.21 V for a 3 M KCl electrode (the model performs the reverse conversion). Where the measured potential lies in the Fe²⁺ region the surface dulls and, in the aerated cell, the solution turns yellow-brown as dissolved iron oxidises; where it lies in an oxide region the surface remains bright. Use gloves and eye protection with the acidic buffer, and dispose of iron-containing solutions in accordance with laboratory procedures.
4.5 Limitations
A Pourbaix diagram describes equilibrium at a single temperature, conventionally 25 °C, and contains no kinetic information. It shows, for example, that iron in neutral aerated water can form Fe₂O₃, but not whether that oxide forms a protective passive film or a porous, non-protective rust. The simple iron–water diagram also omits other dissolved species. Chloride ions break down passive films locally and cause pitting at potentials the diagram classifies as passive, which is why stainless steels are ranked by pitting-resistance tests rather than by their Pourbaix diagrams alone. Complexing agents such as ammonia for copper or cyanide for gold create corrosion regions absent from the metal–water diagram, and every boundary shifts with temperature. The diagram is best treated as the first step of a corrosion assessment rather than the last.
5. Quantitative link between the two diagrams
The two diagrams are not merely analogous; at 25 °C they contain the same thermodynamic information. Writing the reduction of an oxide in water per mole of O₂, , the Ellingham value converts directly into the standard potential of the oxide/metal couple at pH 0:
where 474 kJ is the Gibbs energy of formation of two moles of liquid water. Applied to Cu₂O, which lies high on the Ellingham diagram, the expression gives +0.47 V, in agreement with the Cu₂O/Cu line of Pourbaix's atlas and above the hydrogen line; this is why copper does not dissolve in non-oxidising acids. Applied to alumina, which lies far down the diagram, it gives about −1.5 V: thermodynamically aluminium should react readily with water, and in practice it is protected only by its thin oxide film. Applied to liquid water itself it gives exactly zero, so the hydrogen line of the Pourbaix diagram is the water line of the Ellingham diagram expressed as a potential.
Further detail. Because each Ellingham line refers to one mole of O₂, the vertical separation of two lines is the standard Gibbs energy of the corresponding reduction, and . The , CO/CO₂ and H₂/H₂O nomographs solve this relation for the respective equilibria; their origins are the point O at ΔG° = 0, T = 0, and the points C and H at the 0 K intercepts of the 2CO + O₂ → 2CO₂ and 2H₂ + O₂ → 2H₂O lines. Three approximations underlie the straight lines. Wüstite is unstable below about 570 °C, where Fe₃O₄ and Fe form the equilibrium pair, so the FeO line in that range is a convention. Phase changes introduce changes of slope (aluminium melts at 660 °C, FeO at about 1,377 °C). Dissolved elements are not at unit activity, so silicon and manganese dissolved in liquid iron are reduced more readily than their pure-element lines suggest, which is how they enter blast-furnace hot metal. For quantitative work, NIST-JANAF data [3] should be used in place of linear fits.
6. Implications for electrochemical technology
Both diagrams point towards electrochemical processing where thermal methods reach their limits. Aluminium could not be produced economically by any furnace route. In 1886 Charles Martin Hall in the United States and Paul Héroult in France independently showed that alumina dissolved in molten cryolite at about 960 °C can be reduced by an electric current. Carbon still ends up bound to the oxygen, as CO₂ at the anode, but the electrical work supplies the Gibbs energy that heat alone could not. Low-carbon ironmaking is moving in the same direction, through hydrogen from water electrolysis and through molten oxide electrolysis, in which iron ore dissolved in a molten oxide at around 1,600 °C is reduced to liquid iron while oxygen is released at an inert anode.
The electrolysers themselves pose a Pourbaix problem. The anode of a proton-exchange-membrane electrolyser operates in acid at more than 1.5 V, far above the oxygen line and in a region of the diagram where almost every metal dissolves. For this reason the anode catalyst is iridium oxide, and titanium components, which survive by passivation but form a poorly conducting oxide, are coated with platinum or gold. Computational databases such as the Materials Project now generate Pourbaix diagrams for thousands of compounds [5], allowing candidate catalysts and coatings to be screened for stability before they are synthesised.
7. Summary
The Ellingham and Pourbaix diagrams express the same quantity, the Gibbs energy of metal oxidation, against the variables that control it in two environments: temperature and gas composition at high temperature, and electrode potential and pH in water. The Ellingham diagram explains why carbon reduces iron oxide above about 750 °C but alumina only above about 2,050 °C, and why hydrogen-based reduction requires a large excess of hydrogen. The Pourbaix diagram explains why iron corrodes in acid, passivates in alkaline concrete and can be protected by lowering its potential. At 25 °C the two are linked exactly through , and both identify electrochemical routes as the means of producing and protecting metals where thermal routes are insufficient.
References
- H. J. T. Ellingham, “Reducibility of oxides and sulphides in metallurgical processes”, Journal of the Society of Chemical Industry, vol. 63, pp. 125–133, 1944.
- D. R. Gaskell, D. E. Laughlin, “Introduction to the Thermodynamics of Materials, 6th edition”, CRC Press, 2017.
- M. W. Chase Jr., “NIST-JANAF Thermochemical Tables, 4th edition”, Journal of Physical and Chemical Reference Data, Monograph 9, 1998. Link
- M. Pourbaix, “Atlas of Electrochemical Equilibria in Aqueous Solutions, 2nd English edition”, NACE, Houston, 1974.
- K. A. Persson, B. Waldwick, P. Lazic, G. Ceder, “Prediction of solid-aqueous equilibria: Scheme to combine first-principles calculations of solids with experimental aqueous states”, Physical Review B, vol. 85, pp. 235438, 2012. doi:10.1103/PhysRevB.85.235438
About the author
METNMAT Research Team
Was this article helpful?
Have research worth publishing?
Submit an article proposal for editorial review by the METNMAT team.